Histogram
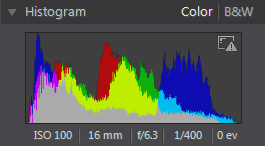
The histogram is a graphical representation of the color tone distribution in a selected photo. Below the histogram is some metadata information for the photo.

The X axis of the graph represents the RGB color tone value between 0 and 255, while the Y axis indicates the number of pixels in the photo that have this value.
The histogram is created with the three RGB (red, green, and blue) color values given to each pixel in a photo. The gray portions indicate where all three colors overlap on the histogram, while yellow, magenta, and cyan appear when two of the colors overlap.
|
Note: hover the mouse pointer over any pixel on the selected photo to view its RGB tone value in the histogram. |
Converting Photos to Black and White
You can instantly convert a selected photo to black and white using the histogram.
To convert, select B&W. To convert back, select Color on the top of the histogram.
|
Note: after you convert a photo to black and white, the Black and White section of the adjustment panel is enabled. See Black and White Mix for details on adjusting the lightness in black and white photos. |
Viewing Exposed Areas
The histogram can be used to determine if the photo was shot correctly. A photo with a histogram that arcs towards the left, indicates the photo was underexposed (contains a lot of dark pixels), while one that arcs towards the right means there was an overexposure (lots of lighter pixels).
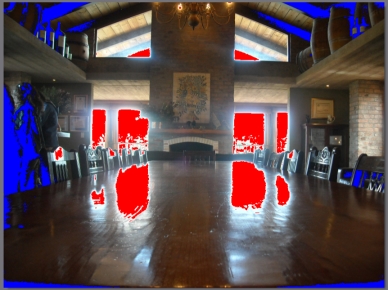
Click  to view the areas of a photo that were so over and underexposed that all detail was lost, or clipped, in that area.

The areas that are overexposed are indicated in red. The areas of the photo that are underexposed, in blue. Click  to hide these areas.